Report-Builder: Peer Rates
New report alert! In addition to our market overview report, we are excited to announce we're adding a new report to Signal: Peer Rates.
The purpose behind Peer Rates is for our users to be able to track a set of providers' contracted rates everywhere they appear in-network.
The report enables quick side-by-side comparison of contracted rates amongst peers and automatic updating month-over-month to see how providers' contracts evolve (e.g., new networks they appear in, rate adjustments on existing contracts, etc.).
Entering Peer Rates
When you enter Signal, you will see 5 modes for exploring price transparency data:
- "Explore" mode is the go-to rates query engine for payer-posted and/or hospital-posted data
- "Compare" mode allows you to do comparisons across markets and providers
- Peer Rates mode should be used when you are comparing 2 or more providers across a defined set of codes
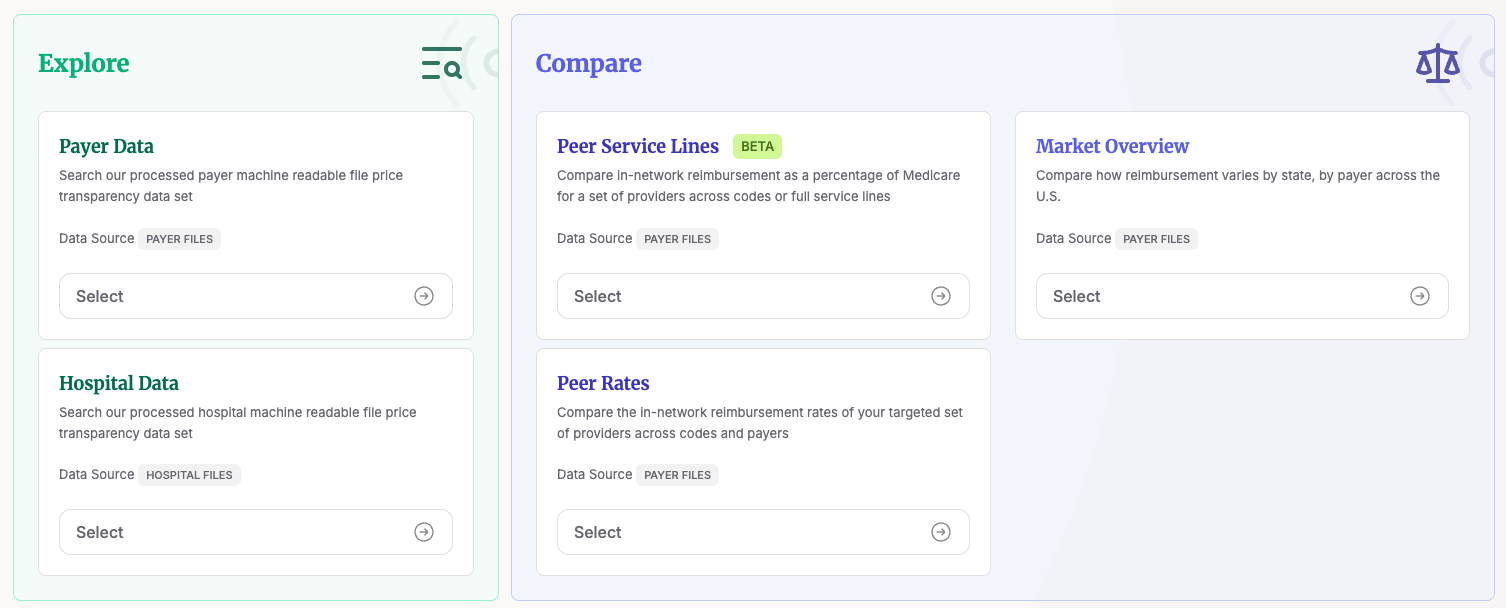
Let's click on 'Peer Rates' to get started.
Building, exporting, and exploring peer rate reports
Once you enter the peer rate report mode, you will see the same set of panels you are familiar with for search mode — but with the following key differences:
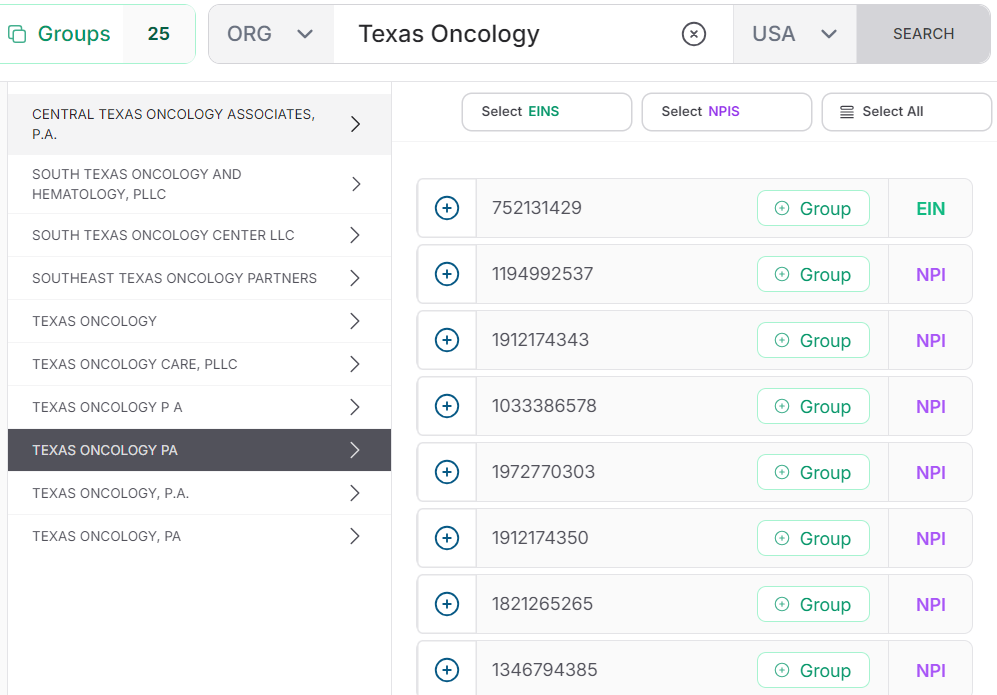
- Compared to "Explore" mode where you have to specify a payer, all you need to generate a peer rates report is to select at least 1 EIN / provider group and a code — we will then query all the networks in our library to surface all the in-network contracted rates that appear in the provider's fee schedule disclosed by each payer
- Before using this report, we first recommend reading our provider search guide to understand concepts like a provider's EIN, Type-2 NPI and our provider groups article to make full use of peer rates' functionality
Once you have access to the right EINs, NPIs, you can generate a report simply by selecting which EINs / providers or groups you would like to see rates for and then clicking "Generate Report":
Then, for your given set of selected EINs and codes, peer rates will automatically load in all the rates Serif Health has access to across our entire payer price transparency library:
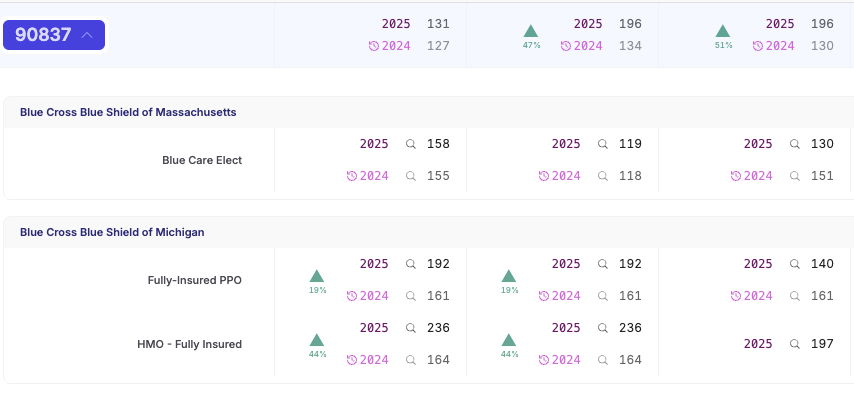
- Additionally, for each code and EIN / group, you must select one of the following options to aggregate the data by:

- Most NPIs: Recommended by default; grabs the rate associated with the largest npi-list. See 'why' this is our recommended methodology by reviewing https://help.serifhealth.com/article/24-how-should-i-pick-between-multiple-rates
- Min: Useful if interested in the floor allowed-amount across all billing scenarios. For example, 'telehealth' / 'facility' place of service for a nurse assistant / other Masters level professional.
- Max: Useful if interested in the highest allowed-amount across all billing scenarios. For example, 'office' place of service for a specialized physician.
-
If any data point piques your interest, you can always dive deeper into any given cell and see the full raw data the payer disclosed. For example, curious about the underlying data for this cell? Just click the magnifying glass icon and see in normal Signal format:
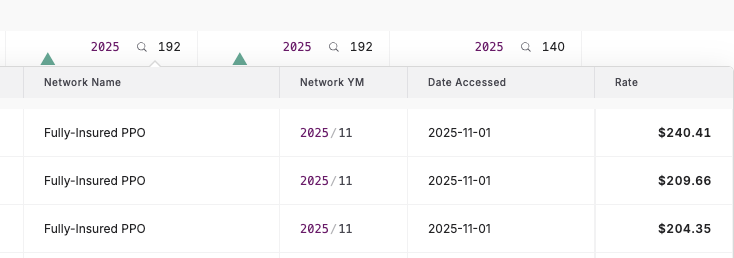

- If you have a question on what a certain attribute means, please consult our data dictionary here: https://help.serifhealth.com/article/19-data-dictionary
- Lastly, if you would like to view all the information generated from the report, feel free to export the data to .csv.
If you need to edit or further narrow down the results, the following filters you are familiar with in search mode are available for use:
- Payers: you can always select down the health plans you want to analyze (e.g., to just United, Cigna, Aetna) for example
- Modifiers: by default, we exclude these to ensure apples-to-apples comparison against global rates in listed distributions but if you would like to look at specific modifiers (e.g., 'TC' for the technical component of radiology procedures) you can
- Other filters:
- Arrangement: Defaulted to fee-for-service to again ensure valid, like-for-like comparison across distributions
- Negotiation Type: Percentage of billed charges arrangements excluded to ensure all rates are comparable dollar amounts
- Billing Class: Both professional and institutional provided by default; further filtering suggested to avoid mixing pro and facility fees
- Is Billable: Balanced selected by default — more detail here: https://help.serifhealth.com/article/6-how-does-the-price-transparency-data-differ-from-claims-data
- Hide Outliers: On by default to filter out 'noise' from placeholder rates (e.g., $99,999.99 for a 30 minute office visit)
Regions and Taxonomies filters are unavailable in Peer Rates mode given the report already selects down to specific providers.
Other important notes:
- Peer Rates only performs searches on entries in the 'EIN' field. This means we do not search Type-1 NPIs (e.g., individual professionals) in provider groups.
- For each payer and code, Peer Rates will aggregate across all the relevant 'EIN' entries in the provider group. For example, let's say your provider group has 2 EINs: '871927518', '841856765' and you search 90837 in Cigna:
- The raw data has 3 entries: 1 for EIN 871927518 (top row) and 2 for EIN 841856765 (bottom two rows).
-

- In Peer Rates, you will see the following result depending on which aggregation method you choose:
- Most NPIs: This will grab the last row with 6745 npi's and return the rate as $109
- Min: This will grab the second row with 1 npi in Colorado and return the rate as $74
-
Max: This will grab the first row with 1419 npis and return the rate as $109
We hope this report is useful and would love to hear feedback on any enhancements or suggestions to further improve the platform. If you have any questions or ideas, feel free to reach out to support@serifhealth.com