Report-Builder: Peer Service Lines
Last updated: July 9, 2026
We are excited to announce we're adding our most powerful report to-date to Signal: Peer Service Lines! Peer Service Lines represents a breakthrough in the way you can analyze price transparency data in a rolled-up manner, giving you insights you've never seen before. Have you ever been interested in:
Comparing health system contracts as a percent of Medicare for all inpatient and outpatient services?
Comparing provider groups' rates across entire service lines, not just at the code level?
Summarizing reimbursement trends across providers relative to the baseline of your choice (e.g., Medicare, DRG Weights, Commercial Medians, etc.)?
With Peer Service Lines - you can now summarize reimbursement rates relative to a baseline (e.g., percent of Medicare) and rollup across codes and service lines so you can easily compare a target set of providers.
Entering Peer Service Lines (Payer and/or Hospital)
There are a few ways to access Signal's Peer Service Lines (PSL) modes:
If you input a payer, hospital, and service category, Signal will route you to Hospital Peer Service Lines mode
If you input a payer, provider, and service category, Signal will route you to Payer Peer Service Lines mode
Manually select Payer / Hospital Peer Service Lines from the bottom of the configuration panel.

Payer and Hospital PSL operate under the same mechanics. The only difference lies in the underlying data that's powering each respective mode: payer price transparency data powers Payer PSL while Hospital price transparency data powers Hospital PSL.
Note: In this guide, we'll walkthrough Peer Services Lines using only Payer PSL. However, the same operating principles apply to Hospital PSL as well.
Setting up a Payer Peer Service Line reports
Once you enter the Payer Peer Service Lines report mode, you will see the same set of panels you are familiar with — the following is required to generate a report:
1 payer network (e.g., UnitedHealthcare Choice Plus PPO)
At least 1 service category OR at least 1 code
Service Categories are recommended in this mode — if you are searching at a code level, we recommend that you use Peer Rates mode
At least 1 provider EIN or provider group
Before using this report, we first recommend reading our provider search guide to understand concepts like a provider's EIN, Type-2 NPI and our provider groups article to make full use of peer rates' functionality
Once you have access to the right EINs, NPIs and/or Groups, you can generate a report simply by selecting which EINs / providers or groups you would like to see rates for and then clicking "Generate Report"
Serif Health's 'Service Categories'
As a note on Service Categories — this is a new feature that the Serif Health team has developed by grouping codes together based on usage in the real world. Our Service Categories are also separated into subcategories, and each level can be selected when building a report. For example, the "Inpatient (DRGs)" category can be selected to roll-up rates across all DRGs, or a subcategory can be selected if you are interested in specific DRG codes (e.g., Burns).

You can hover over the three lines next to # codes and see the codes wrapped under each subcategory.

Feel free to reach out to support@serifhealth.com if you have any questions around our categories and subcategories!
Interpreting results
Then, for your given set of selected providers and service categories / service subcategories / codes, Peer Service Lines will automatically display results relative to the relevant Medicare baseline (as a percentage of Medicare). You will be able to see a graphical representation at the top of the screen, with underlying details below it.

Now lets dive into all of the different toggles / features here.
The first toggle to point out is at the bottom left - you can review results by:
Code (if you selected individual codes)
Service Category (if you selected a service category and/or subcategories)
Service Subcategory (if you selected a subcategory)
Network
Picking Code will give you the percent of Medicare results for the individual codes you added to your search — in the example below, the user selected DRG 470 across 2 hospital groups.
The darker bars represent 2026 data, and the lighter bars represent 2025 data. Historical data can be accessed by clicking the watch & arrow icon on the top right
You can hover over each bar to see the values
The underlying results are located at the bottom of the screen

Picking Service Category will give you results of all of the subcategories combined (based on the subcategories you selected in your search). When setting up a search, you can also just pick an overall category (without specifying a subcategory) to see results for the entire category.

Picking Service Subcategory will break out the results by subcategory - in the example below, we see DRGs broken out into different categorizations of top codes (MS-DRGs, Outpatient Codes, Primary Care Provider Codes, e.t.c)

Finally, picking Network will show results across all the codes / service lines you selected rolled-up at the provider Network level. In the example below, across the DRGs that the user selected, it looks like Baylor Scott & White receives on average 228% of Medicare (IPPS) with UnitedHealthcare Choice Plus PPO.

The next toggle to point out is at the bottom — where you can change the methodology you would like the system to use to aggregate results.

In the first button ("Select rates by"), you have the following options on how you would like the system to select rates for a given EIN / code combination:
Most NPIs: Recommended by default; grabs the rate associated with the largest npi-list. See 'why' this is our recommended methodology by reviewing https://help.serifhealth.com/article/24-how-should-i-pick-between-multiple-rates
Min: Useful if interested in the floor allowed-amount across all billing scenarios
Max: Useful if interested in the highest allowed-amount across all billing scenarios
In the second button ("See results by"), you have the following options on how you would like the system to display percent of baseline results:
Mode: Results are the most common percent of baseline across the service category / subcategory
Average: Results are the average percent of baseline across the service category / subcategory
Weighted Average: Results displayed are the sum of rates divided by the sum of baseline — this methodology will weight more expensive / higher cost codes higher than the lower cost codes
Median: Results are the median percent of baseline across the service category / subcategory
Note: This panel is only available when displaying results by Service Category or Service Subcategory
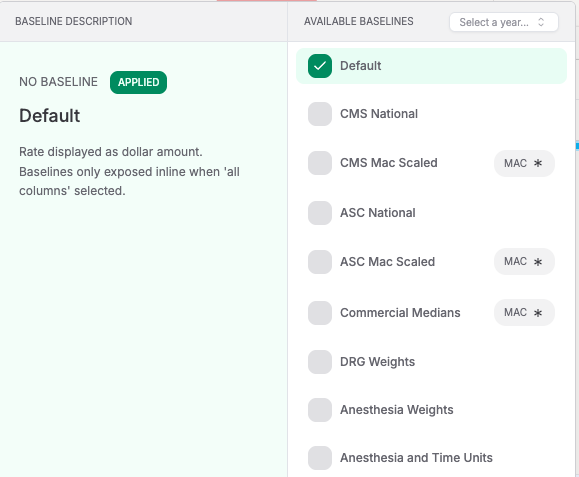
In the third button ("Apply"), you have the opportunity to select the relevant baseline that you would like to compare your results against. By Default — for each row of data, we bring in our best guess on what Medicare would pay (considering the code, modifier, place of service, location, and other details for each row of data), and results are displayed as a percent of Default. But you can override results to any baseline you would like (e.g., DRG Weights, CMS National Baselines, etc.) which will dynamically change results.
For a comprehensive overview of our baseline methodology and override feature, please read this article: https://help.serifhealth.com/article/35-using-additional-baselines
In our example from above, I can choose a "DRG Weights" baseline override and see results as base-rate conversion factors.

Lastly, if you would like to view all the information generated from the report, feel free to export the data to .csv.
If you need to edit or further narrow down your search, the following filters you are familiar with in search mode are available for use:
Payers: you can select a different payer network to perform a search on
Modifiers: by default, we exclude these to ensure apples-to-apples comparison
Other filters:
Arrangement: Defaulted to fee-for-service to again ensure valid, like-for-like comparison across distributions
Negotiation Type: Percentage of billed charges arrangements excluded to ensure all rates are comparable dollar amounts
Billing Class: Both professional and institutional provided by default; further filtering suggested to avoid mixing pro and facility fees
Is Billable: Balanced selected by default — more detail here: https://help.serifhealth.com/article/6-how-does-the-price-transparency-data-differ-from-claims-data
Hide Outliers: On by default to filter out 'noise' from placeholder rates (e.g., $99,999.99 for a 30 minute office visit)
Taxonomies: Allows you to filter only down to certain taxonomies
Other important notes:
Peer Service Lines only performs searches on entries in the 'EIN' field. This means we do not search NPIs (e.g., individual professionals) in provider groups
For each payer and code, Peer Service Lines will aggregate across all the relevant 'EIN' entries in the provider group. For example, let's say your provider group has 2 EINs: '871927518', '841856765' and you search 90837 in Cigna:

The raw data has 3 entries: 1 for EIN 871927518 (top row) and 2 for EIN 841856765 (bottom two rows).
In Peer Service Lines, results will be calculated across all 3 entries
We hope this report is useful and would love to hear feedback on any enhancements or suggestions to further improve the platform. If you have any questions or ideas, feel free to reach out to support@serifhealth.com