Report-Builder: Market Overview
Last updated: July 9, 2026
We are excited to announce we're adding report-builder functionality to Signal, beginning with Market Overview aimed at answering questions like:
Which states have the highest and lowest reimbursement profile for my services of interest?
Within those states, what are the various payers offering for reimbursement at the high-end, median, and low-end?
Which payer partnerships should we pursue and what economics should we expect?
Entering report mode
There are two ways to access Market Overview mode:
Enter only a procedure code in your search. Signal will automatically switch to Market Overview mode.
Manually select Market Overview from the bottom of the configuration panel.
Let's click on Market Overview to get started. You can also prompt the AskSignal AI and it will switch over the mode for you.

Building, exporting, and exploring market overview reports
Once you enter the market overview report mode, you will see the same set of panels you are familiar with for explore mode, but with the following key differences:
The providers panel has been disabled — if you would like to search up specific providers' rates, we recommend going to explore mode and looking at resources like our provider search guide
Compared to explore mode where you have to specify both a payer and a code-set, you only need to input 1 code to generate a market overview report.
So, let's select a code — 99213 — and build a report:
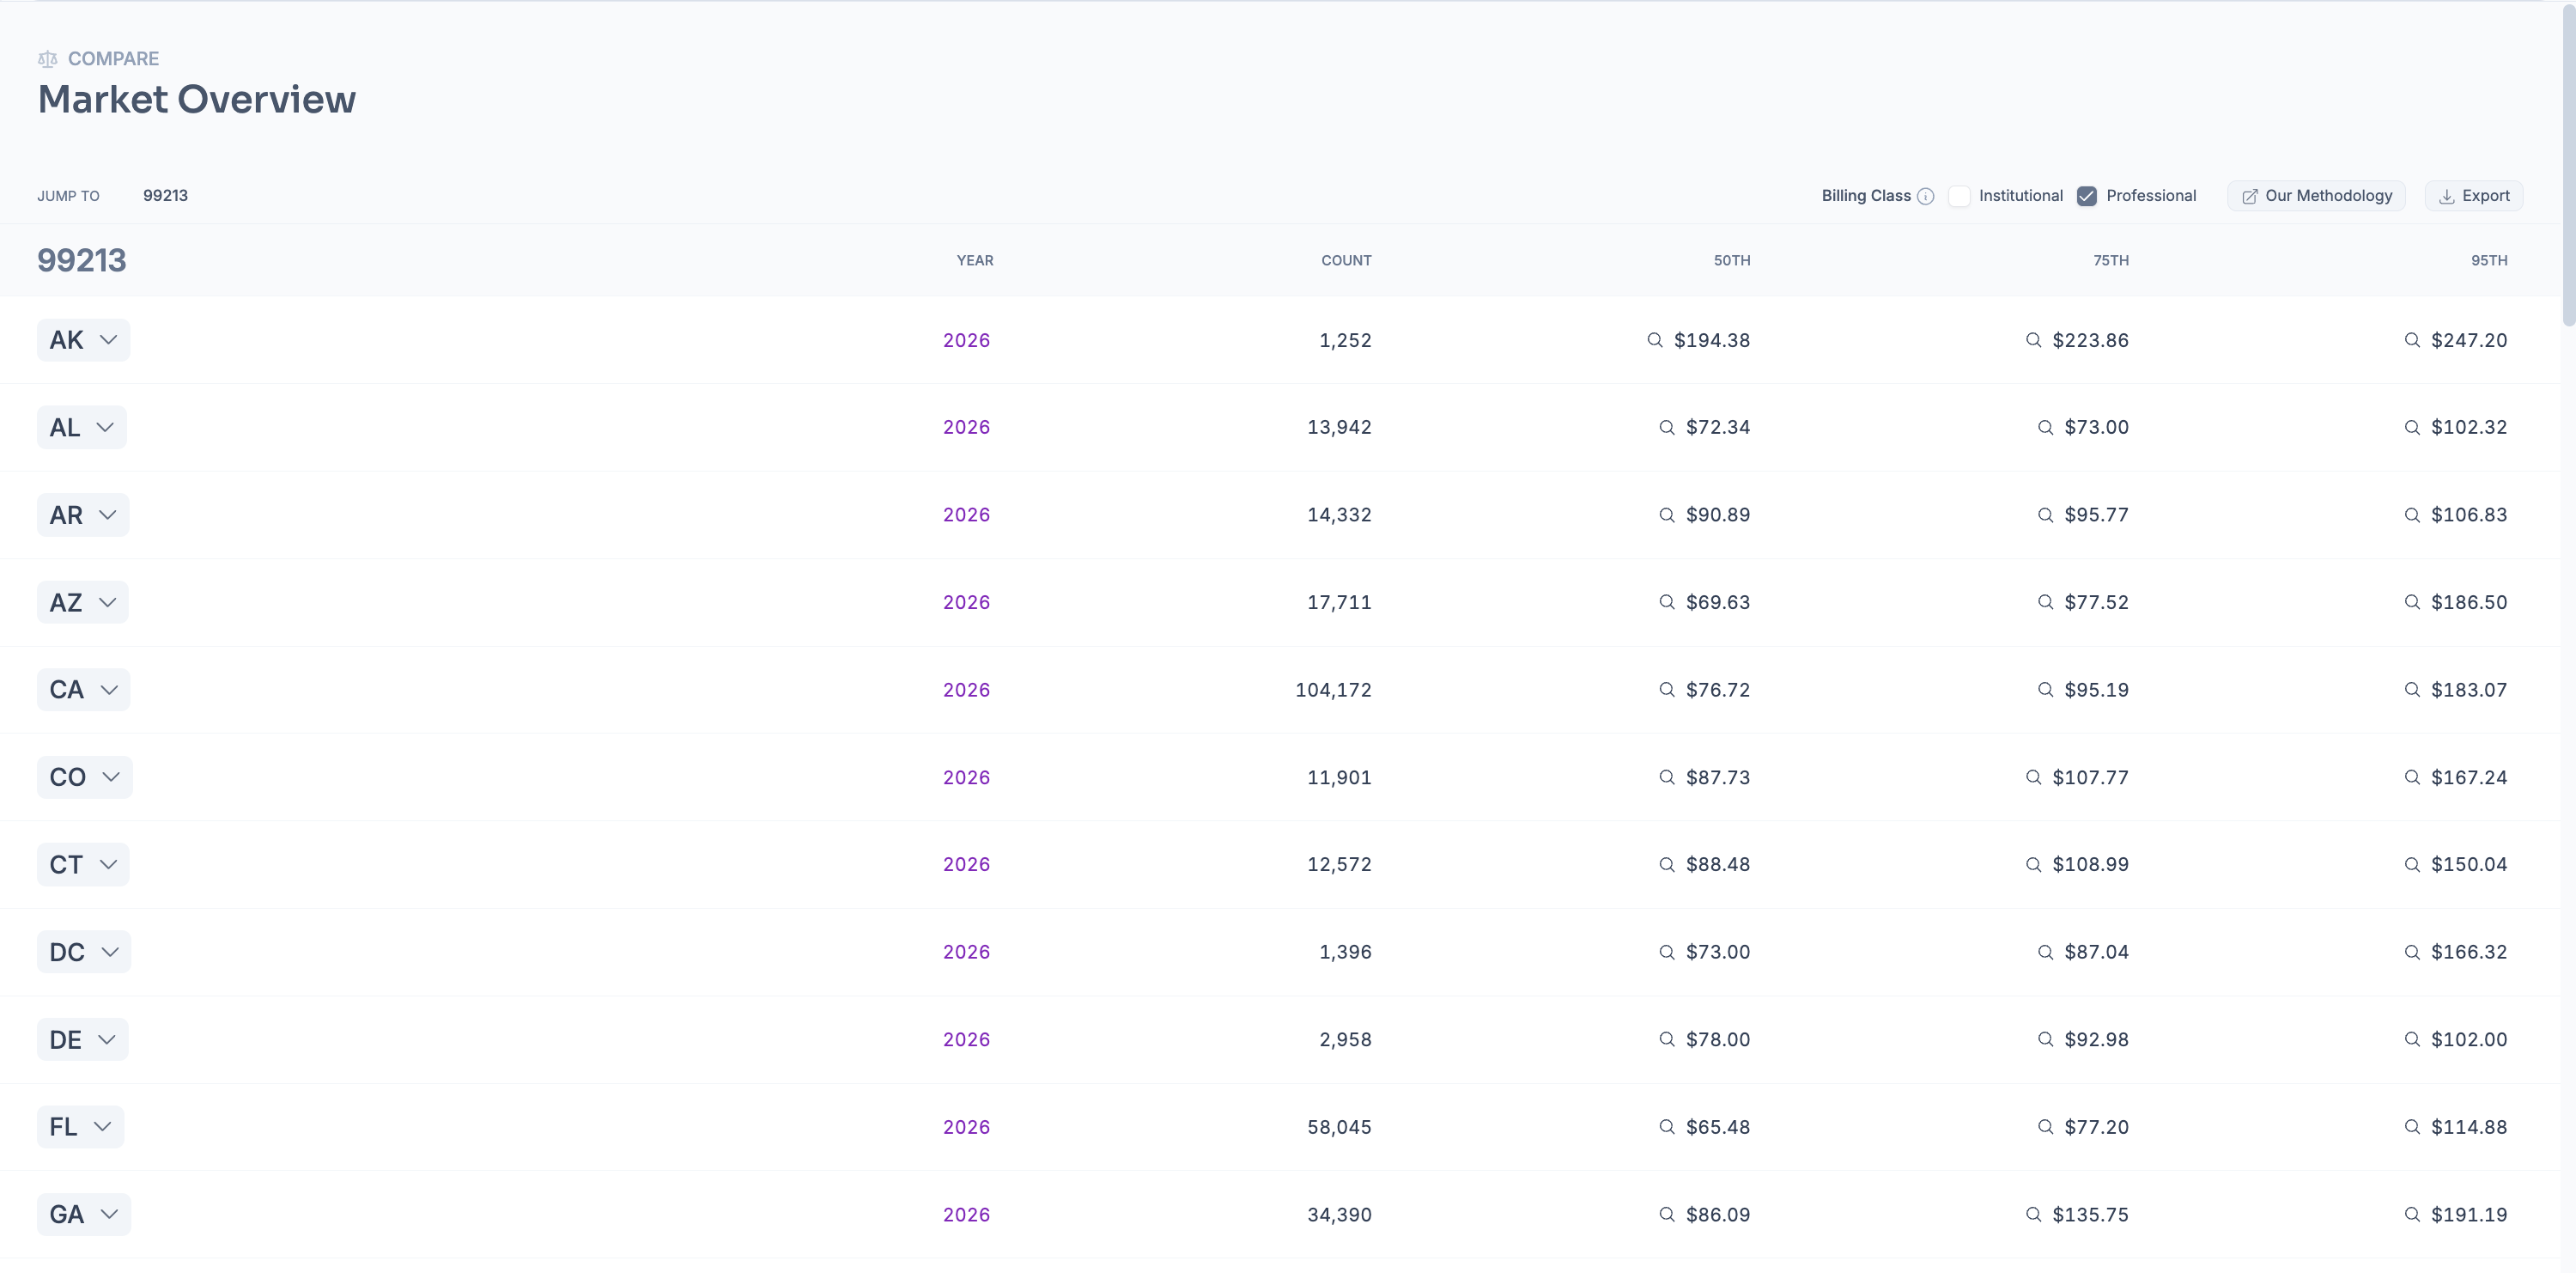
As shown above, the standard output is a grouped table by state showing a percentile distribution for each code selected — from this view:
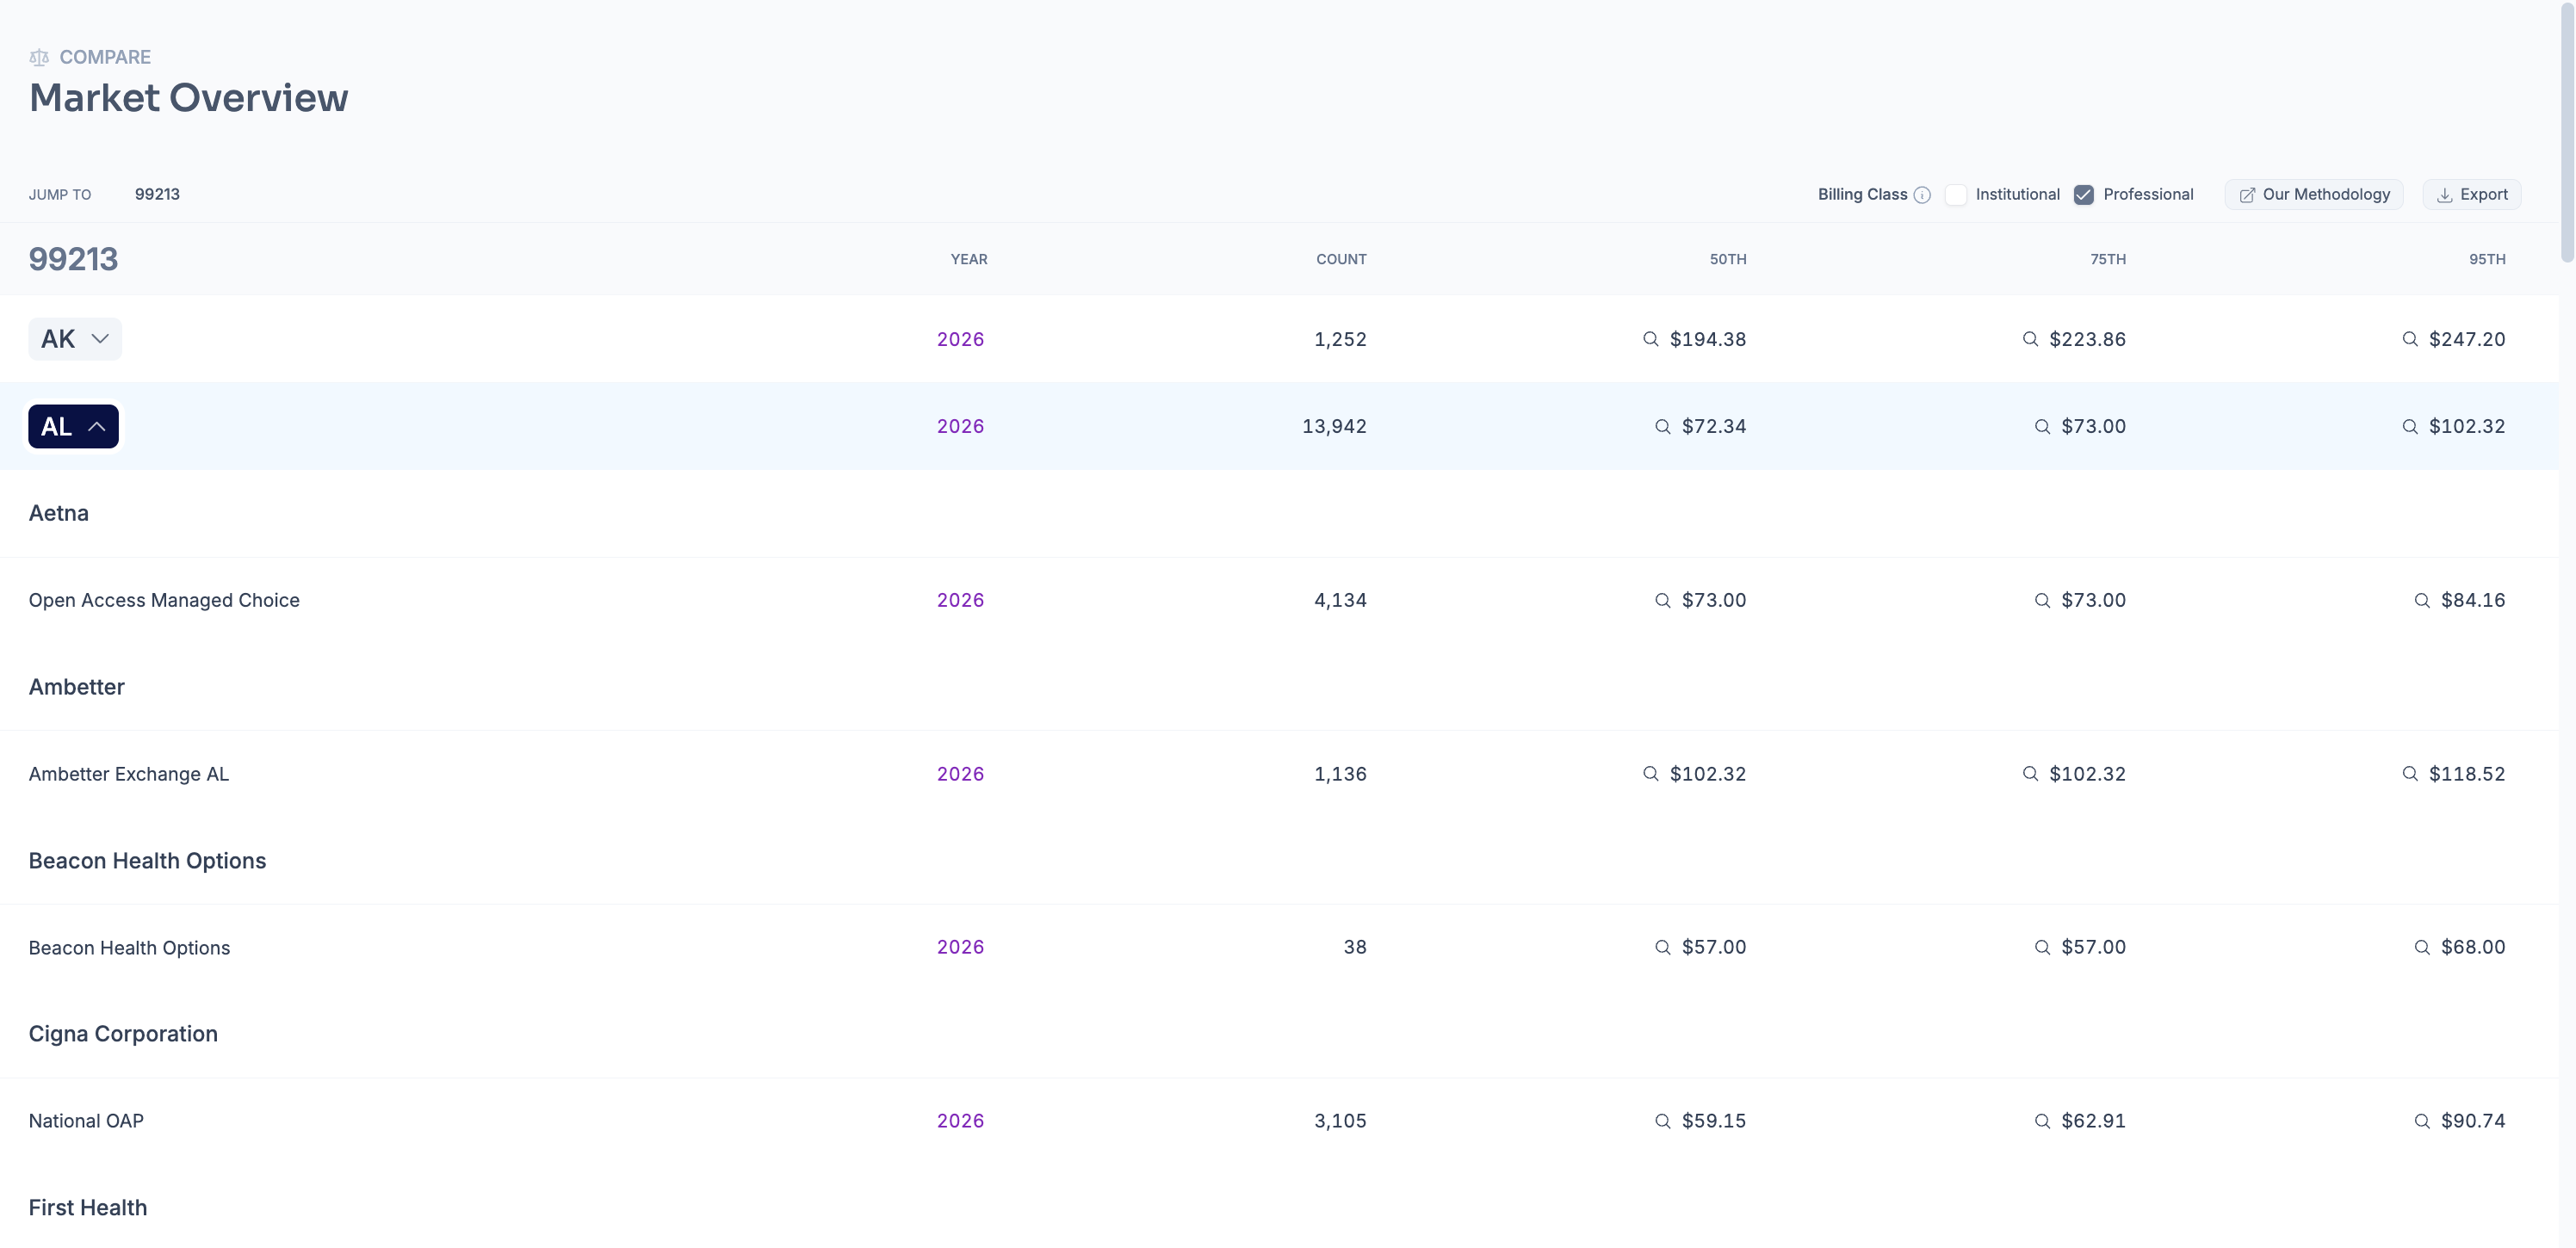
You can expand a state to see what specific payers' reimbursement profiles look like:
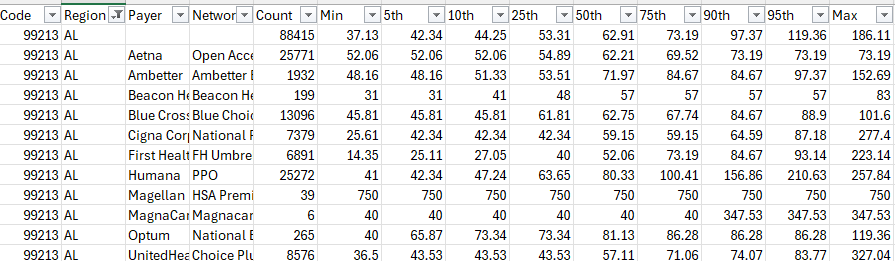
Using the tool-bar, you can export all of the data across all 50 states + DC (including the specific break-downs by payer in each region) to .csv for further analysis
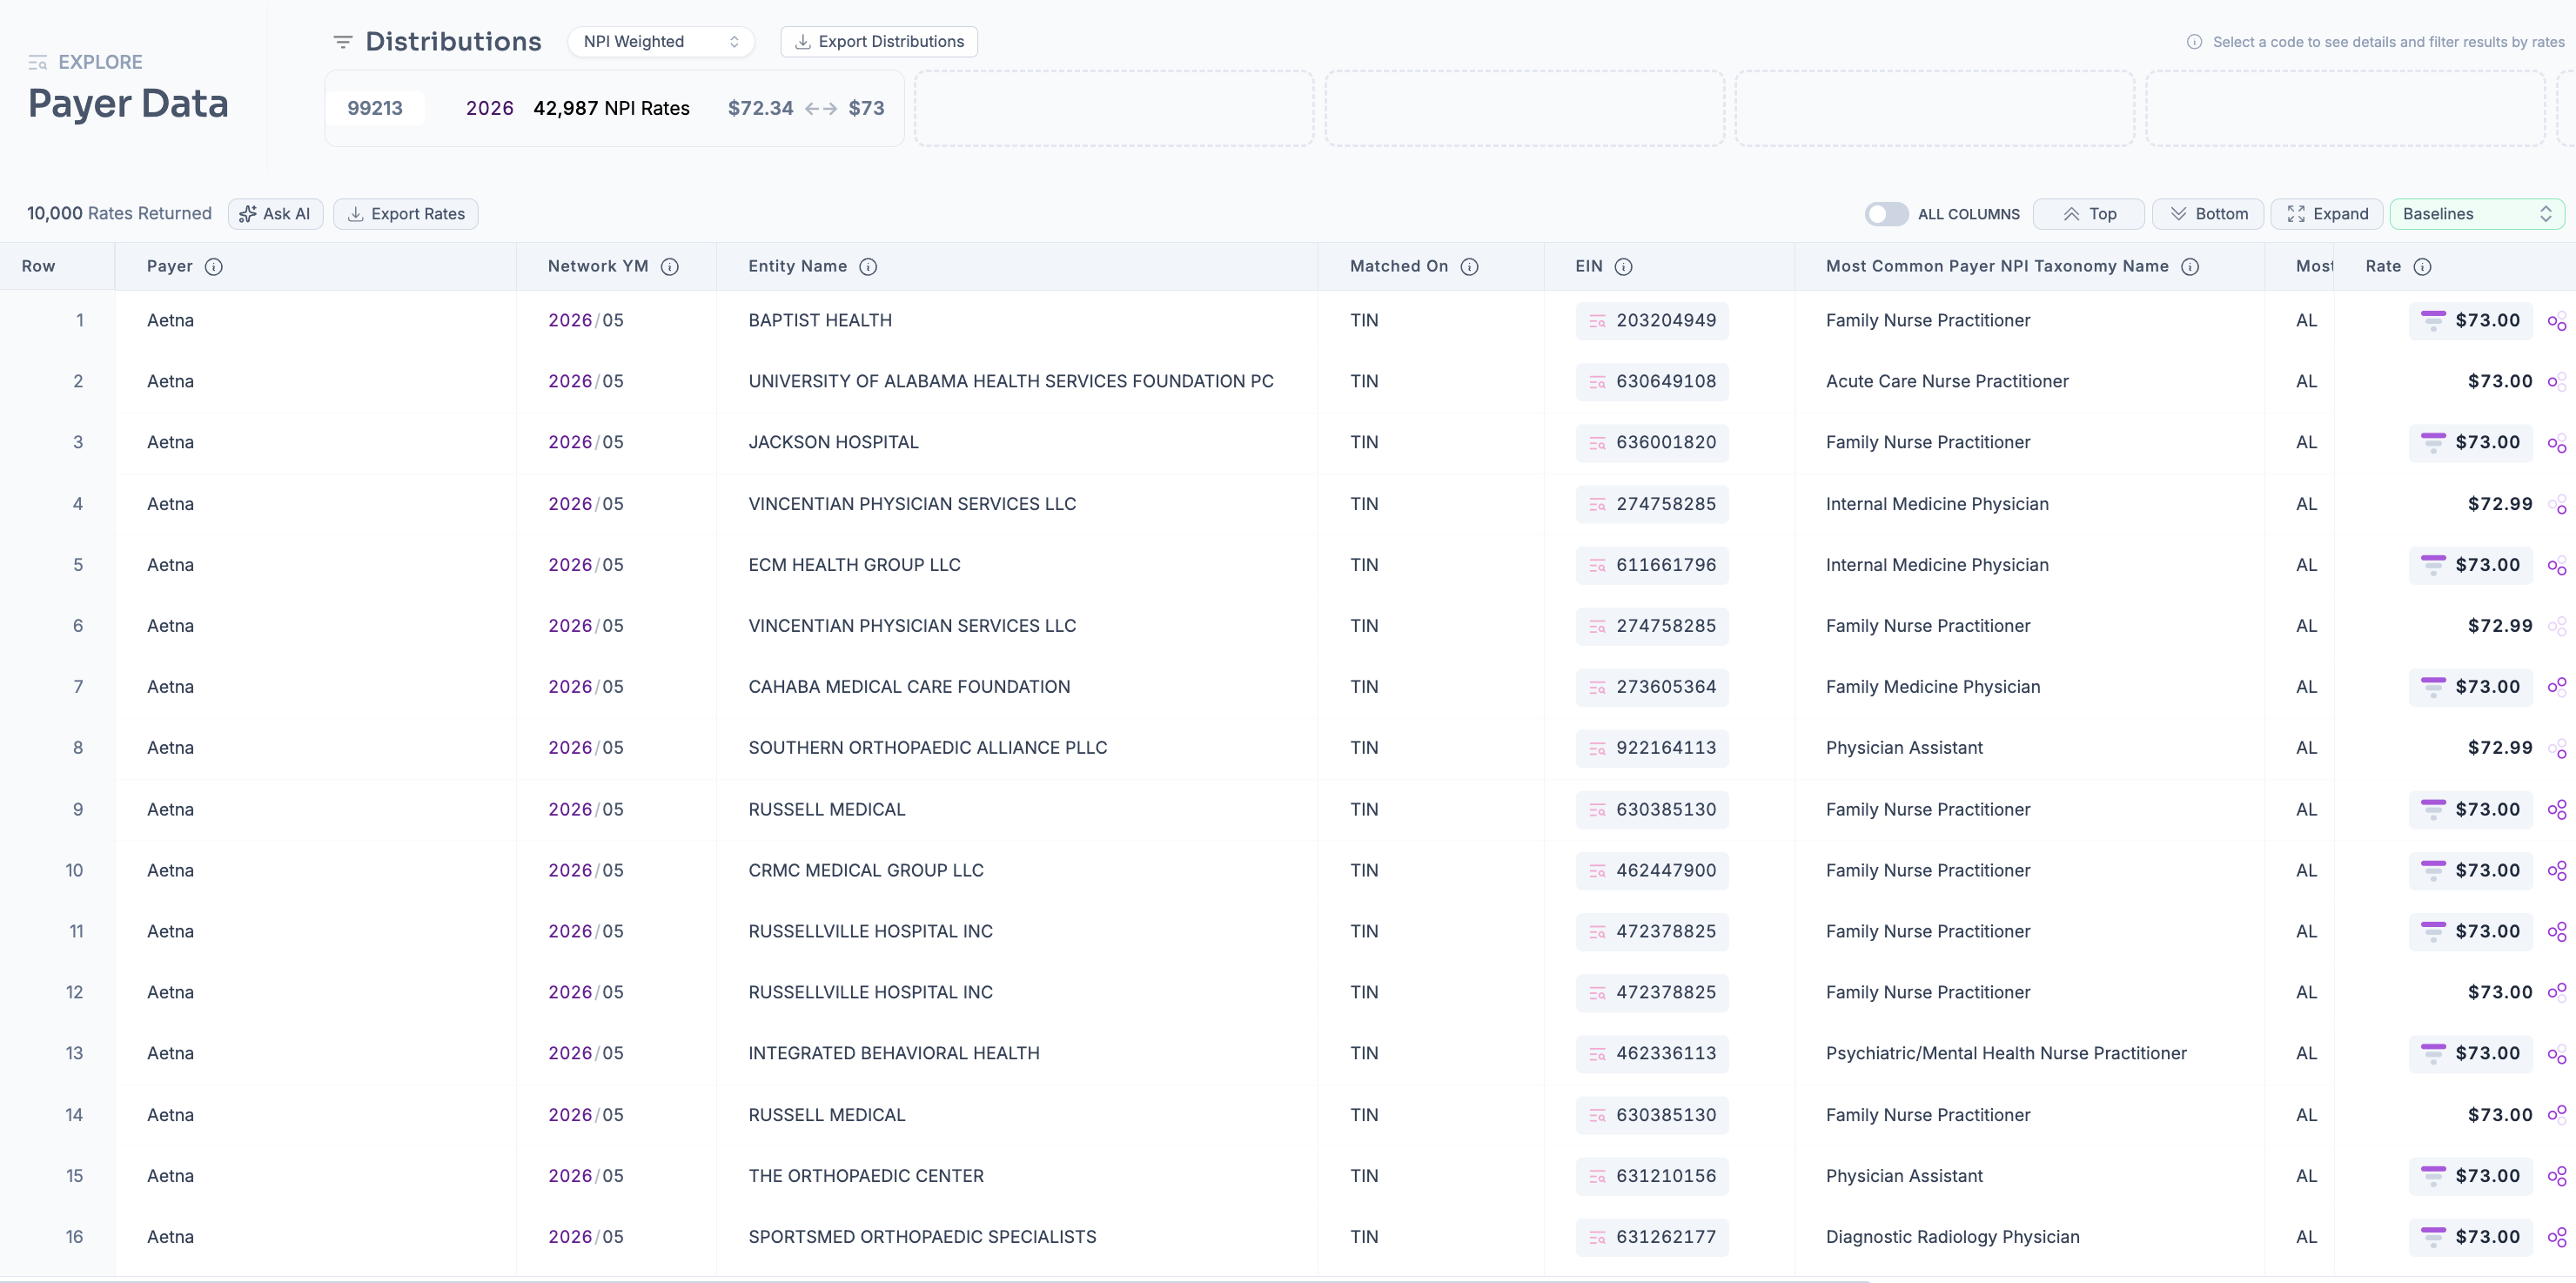
Lastly, you can click any rate you see in the market overview report (via the magnifying glass icon) and see which providers have those rates contracted in payer data mode
If you need to edit or further narrow down your distribution, the filters you are familiar with in search mode are available for use:
Payers: you can always select down the health plans you want to analyze (e.g., to just United, Cigna, Aetna) for example
Taxonomies: to refine your comparison, you can multi-select from various NUCC specialties using this panel (e.g., for ear-nose-throat doctors, search just otolaryngology physicians)
Regions: you can also down-select a specific set of states if nation-wide analysis is not necessary, you can also select a specific CBSA
Modifiers: by default, we exclude these to ensure apples-to-apples comparison against global rates in listed distributions but if you would like to look at specific modifiers (e.g., 'TC' for the technical component of radiology procedures) you can
Other filters:
Arrangement: Defaulted to fee-for-service to again ensure valid, like-for-like comparison across distributions
Negotiation Type: Percentage of billed charges arrangements excluded to ensure all rates are comparable dollar amounts
Billing Class: Professional selected by default to avoid mixing pro fees with facility or institutional fees
Place of Service: Default is all places of service but can select any to narrow down the rates
Is Billable: False excluded to avoid noise from 'junk rates' — more detail here: https://help.serifhealth.com/article/6-how-does-the-price-transparency-data-differ-from-claims-data
Hide Outliers: On by default to filter out 'noise' from placeholder rates (e.g., $99,999.99 for a 30 minute office visit)
We hope this report is useful and would love to hear feedback on any enhancements or suggestions to further improve the platform. If you have any questions or ideas, feel free to reach out to support@serifhealth.com